Validator Node Architecture
Components for running a validator node and monitoring validator behavior
The system architecture of a validator node on the Energy Web Chain is made up of two components:
Together these two components allow validators to run a local node of the chain, validate transactions, seal blocks, and monitor validator behavior and metrics.
OpenEthereum Client
A client is software that allows you to run a local node on your machine and interact directly with the blockchain. Every validator must run a full node in order to participate in validation.
Remember that the Energy Web Chain is derived from the Ethereum blockchain. Because of this we use an Ethereum client to connect with the chain called OpenEthereum. Anyone can create a client, as long as it implements the protocols laid out in Ethereum’s yellow paper, and there are a number of Ethereum clients to choose from.
Energy Web uses the OpenEthereum client because it supports the Authority Roundtable (AuRa), which is a consensus algorithm specifically for Proof-ofAuthority blockchains. OpenEthereum allows validators to connect to the chain, collect transactions and seal blocks according the AuRa consensus algorithm.
To read more about OpenEthereum, you can visit their wiki.
To read more about Ethereum clients, see the Ethereum documentation.
Telemetry Monitoring system
The monitoring system collects comprehensive, real-time data and metrics on validator performance and provides a user interface for viewing the data. It is important to gather as much data about the validator nodes as possible in order to ensure a secure and performant blockchain. To do so, we rely on well established industry solutions to transfer these metrics off the validator node to protect the sensitive nature of the data.
The use of the telemetry monitoring system is opt-in. Validators can disable it if they have their own monitoring system in place that allows for real time tracking of all relevant metrics.
Telemetry Architecture
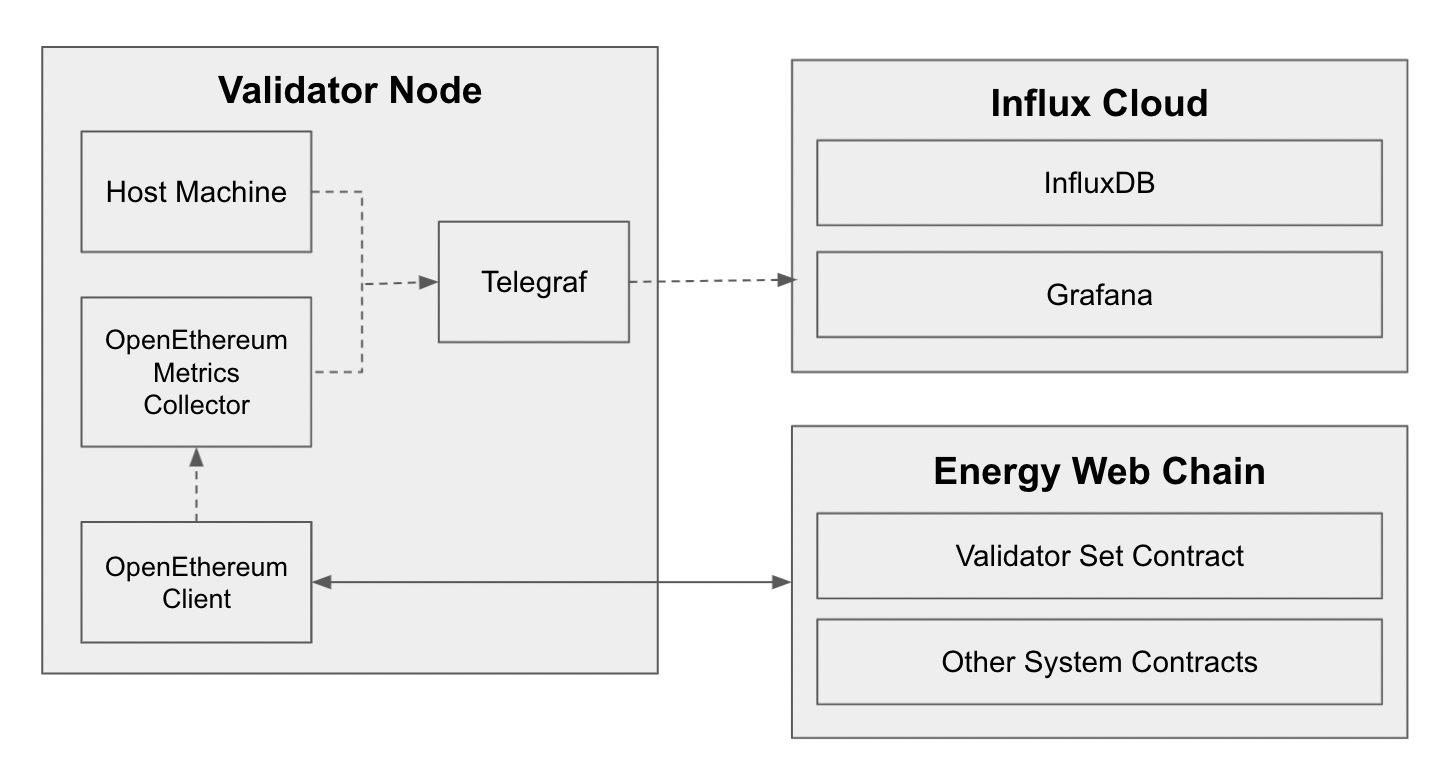
There are four components involved in the data collection process:
OpenEthereum client - monitors validator node behavior
Telegraf: open-source server agent that collects data from the OpenEthereum client
InfluxDB - open source database that stores the data collected from Telegraf
Grafana - data visualization tool that queries the InfluxDB for data and provides graphical interface for data visualization
All components are run in separate docker containers managed by docker compose. For additional information on docker visit: https://docs.docker.com/ and https://docs.docker.com/compose/.
Data Collection Process Overview
The OpenEthereum client collects data on the validator node. Collected data includes:
CPU usage
Memory usage
Disk usage
Number of connected peers
List of visible P2P peers
Current block
Network latency to 3 different and major locations (e.g. cloudflare, google, amazon)
Network throughput
Network error rate
Number of SSH keys
Service status for SSH, docker and the parity container
SHA256 hashes of key system components/binaries
Current chain specification file (or hash)
Telegraf collects relevant metrics from the host machine and the custom-built OpenEthereum metrics collector. The metrics collector allows Telegraf to receive the metrics from the OpenEthereum client
The collected metrics are stored in an InfluxDB database and can be visualized using Grafana
Last updated